
Agile Metrics: What are they? Why should you care? How do we use them effectively? In today’s blog, we are diving into all things agile metrics to help you identify the ones that really matter.
If you’d rather watch a video than read, you can check out my Youtube video on this topic:
Let’s get on with Metrics Basics:
Why care about metrics?
We should care about metrics because they can help you identify where you have been, where you are currently, and where you want to be. Any talk about metrics is really talk about improvement.
What are metrics, really?
Metrics are questions for which you want an answer, such as “am I getting healthier?” They differ from measures, which are how you go about answering these questions. A measure would ask “what is my weight?” or “what is my blood pressure?” Metrics usually aren’t answered in one simple way by just one measure. Metrics that matter invite action to be taken and are in alignment with the thing you want to improve.
Why are agile metrics different?
It can feel difficult to measure things in agile. But the way I see it, agile metrics that matter are actionable and aligned with the desired improvement. They help us become more agile, adaptive, and quick to pivot. They help create a better business and not simply reflect it.
Metrics Anti-Patterns
One thing that can happen with metrics if you don’t consider questions worth answering is that you can fall into certain patterns:
- Weaponizing: Measures that lead to constant comparison of teams or people. Do we want to improve in relation to one another or to oneself? In the realm of agile metrics, this is key.
- Looking good: Measures that make us look good. Go on social media and you can see prime examples of only sharing metrics that look good. You can have a ton of followers but no money coming in. The numbers reflect something that isn’t indicative of something else or what you are really trying to measure.
- Hoarding: Too many measures that become hard to decipher. They don’t tell you much because you are measuring everything, and it results in in-action.
The “weaponizing” and “looking good” patterns result in gaming the system, while “hoarding” results in ignoring the data. In these situations, the data doesn’t reveal anything. It can feel productive to collect data, but you shouldn’t be collecting it just because it’s easy. You need to know how to ask better questions and then you figure out ways to answer.
Agile metrics that matter
There is no recipe for agile metrics but there are ingredients. Think of metrics in terms of categories like work & quality, customer & business, and people & collaboration. Using the agile principles to guide you when creating your categories can be helpful.
The purpose of these categories is to guide you when choosing measures to answer your question. You want to calibrate between them. For example, you could deliver the best product that nobody uses (high work & quality, low customer & business). Or the best product that everyone uses, that wears out the team and isn’t sustainable (high work & quality, high customer & business, low people & collaboration). These can help you identify questions you want answers for.
Work and quality
The work & quality category asks the questions “how good is our stuff?”, “how efficient is our stuff?”
Examples of measures:
Timely releases & deliverables
- Frequency, success rate, speed, and escaped defects
Workload
- Work in process vs. done ratio
- Speed of completion
- Projection of finish line
Issues and support
- Average ticket count: open vs closed
- Issues per category
- Average ticket resolution time
- Time for first contact
- SLAs respected vs deviation rate.
If I am measuring what matters and asking a question worth asking that tells me something about the quality of our work, many times it is related to our business. For this reason, it’s important to understand your business and pipeline.
There are some common examples of work and quality metrics, and not all of them are good. One that isn’t good for agile metrics is velocity. Metrics should come from data that is leaving or has already happened so using measures of story points and hours to gauge velocity isn’t useful. We don’t care about measuring guesses. If you have 3 points out of five done, you don’t know if you’re close to the end or not. How many things are done, not done, or in progress is much more telling, which is why burndowns are much better than velocity.
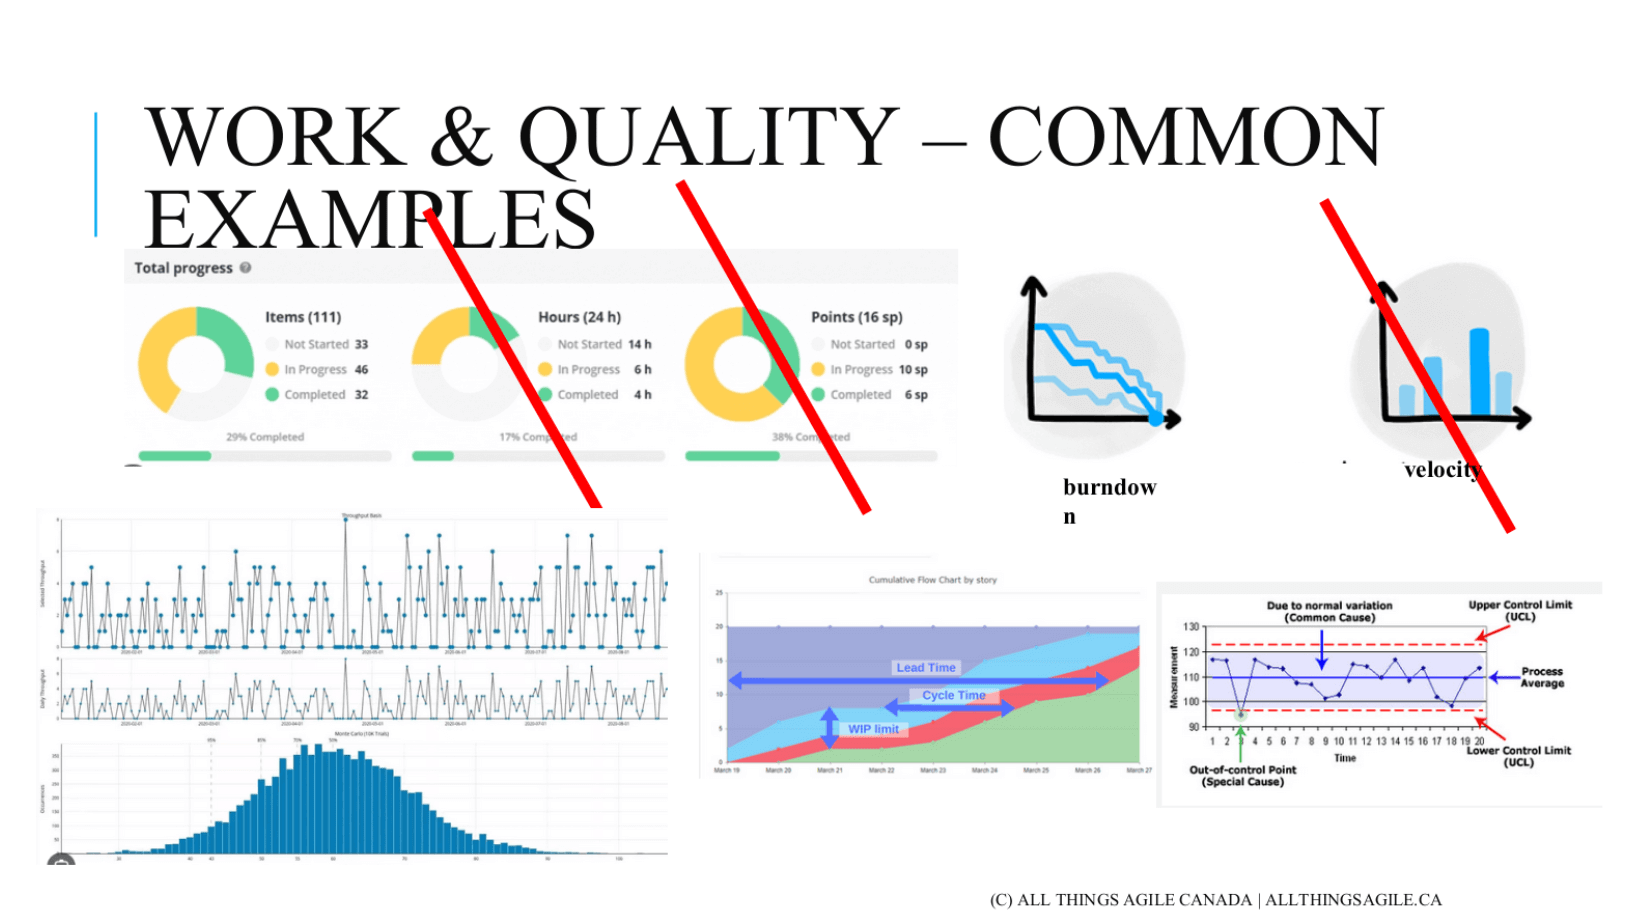
There are other examples as well that are often a bit more complex but still very useful. They can tell us different pieces of the story. Control charts come from statistics and they tell you an average alongside what is happening in reality. This allows you to see stability, as well as an acceptable level of variability.
A percentile can reveal a sweet spot for things but also allows you to understand the variation in your process. You can see how long a process takes on average, but you can also easily view a worst case scenario. You can use this info to give appropriate answers/estimates to your stakeholders.
Customer & Business
We are quick to develop the measures that will answer questions on the IT, production and delivery side, but we are not giving our business, product and sales people the chance to come to the table and ask the question with us. Or, when they have those measures, it’s not shared with us because of a low level of transparency.
Examples of measures:
Customer & market
- Increase/decrease in customer satisfaction, retention,
- Time to customer usage
- Time to learn/gather feedback
Value generation & costs
- Revenue, profit and cost
- $ per client or feature
- CLV – customer lifetime value
- Number of users vs active users
An example of this is the net promoter score, referrals, delivery vs fulfillment, budget forecast, average revenue, and sales targets.
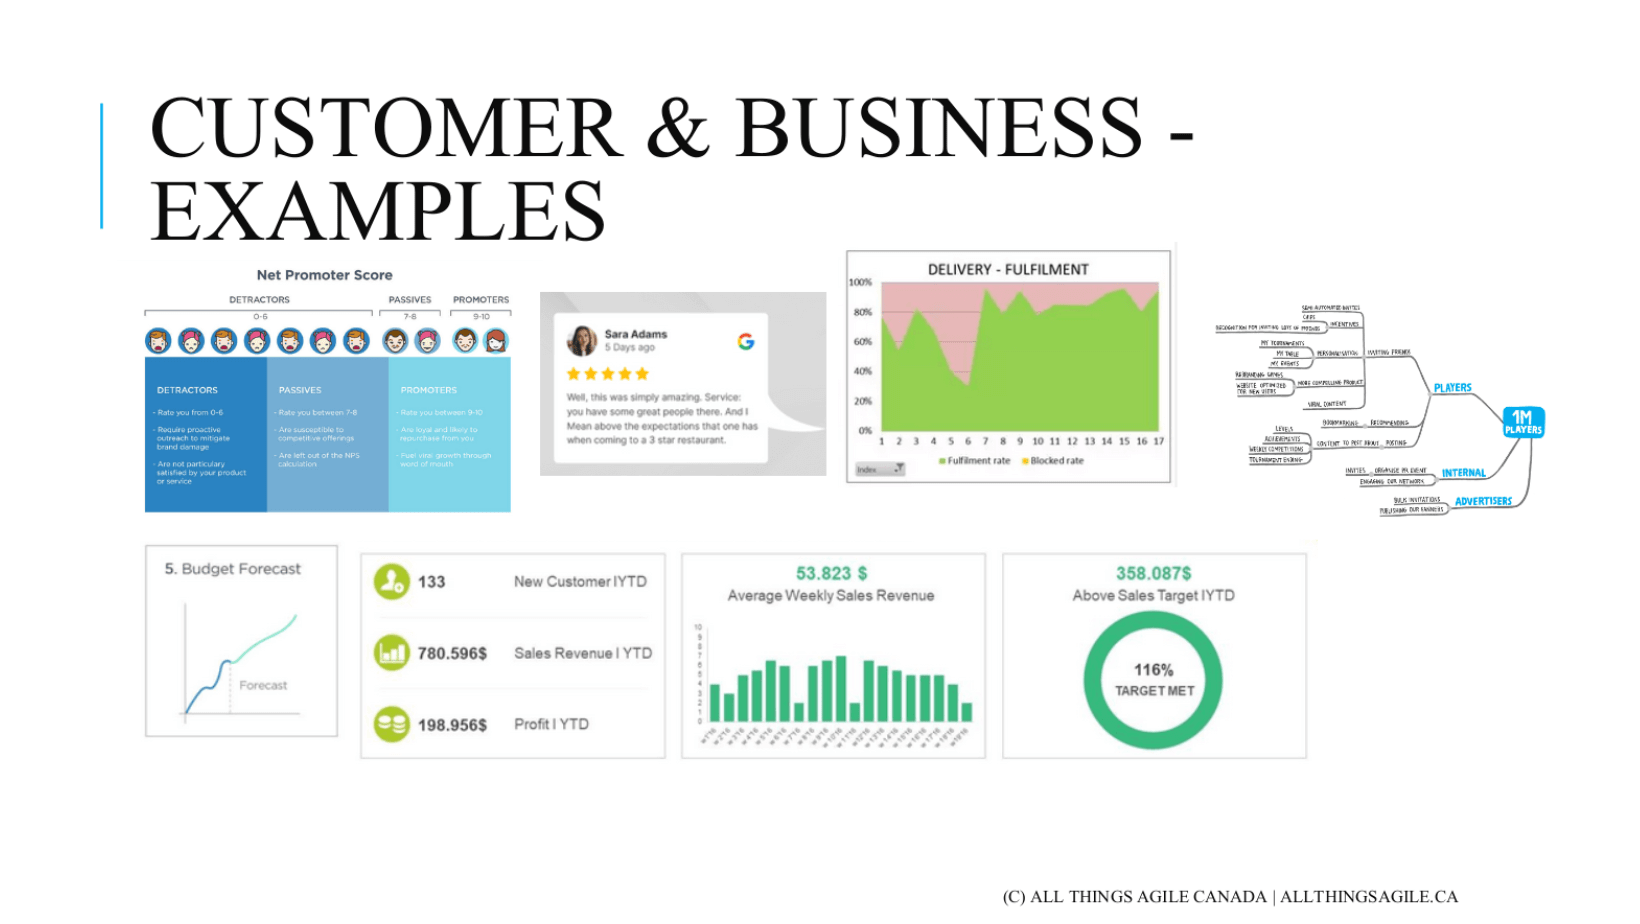
I recommend that you bring business to the table when measuring what matters.
People & Collaboration
This is the category that can be different from traditional metrics because it doesn’t speak only of the work or value being delivered. It is about the people doing the work. Most of the data collected here will be qualitative which can be very valuable.
Examples of measures:
Employee & team morale
- eNPS, Glassdoor, or Gallup
- Absenteeism
- Happiness index
Employee performance
- Peer performance review
- Teamwork
- Ability to receive and use feedback
- Work effectiveness
Combining measures to answer metrics
Usually you won’t have one measure to answer your metric or question. Here are a few scenarios of where you would combine measures:
You want to assess agile team effectiveness
- Your metric: “how well are we delivering our features?”
- We look at defects expected, cycle time, the quality of our releases, and a happiness index
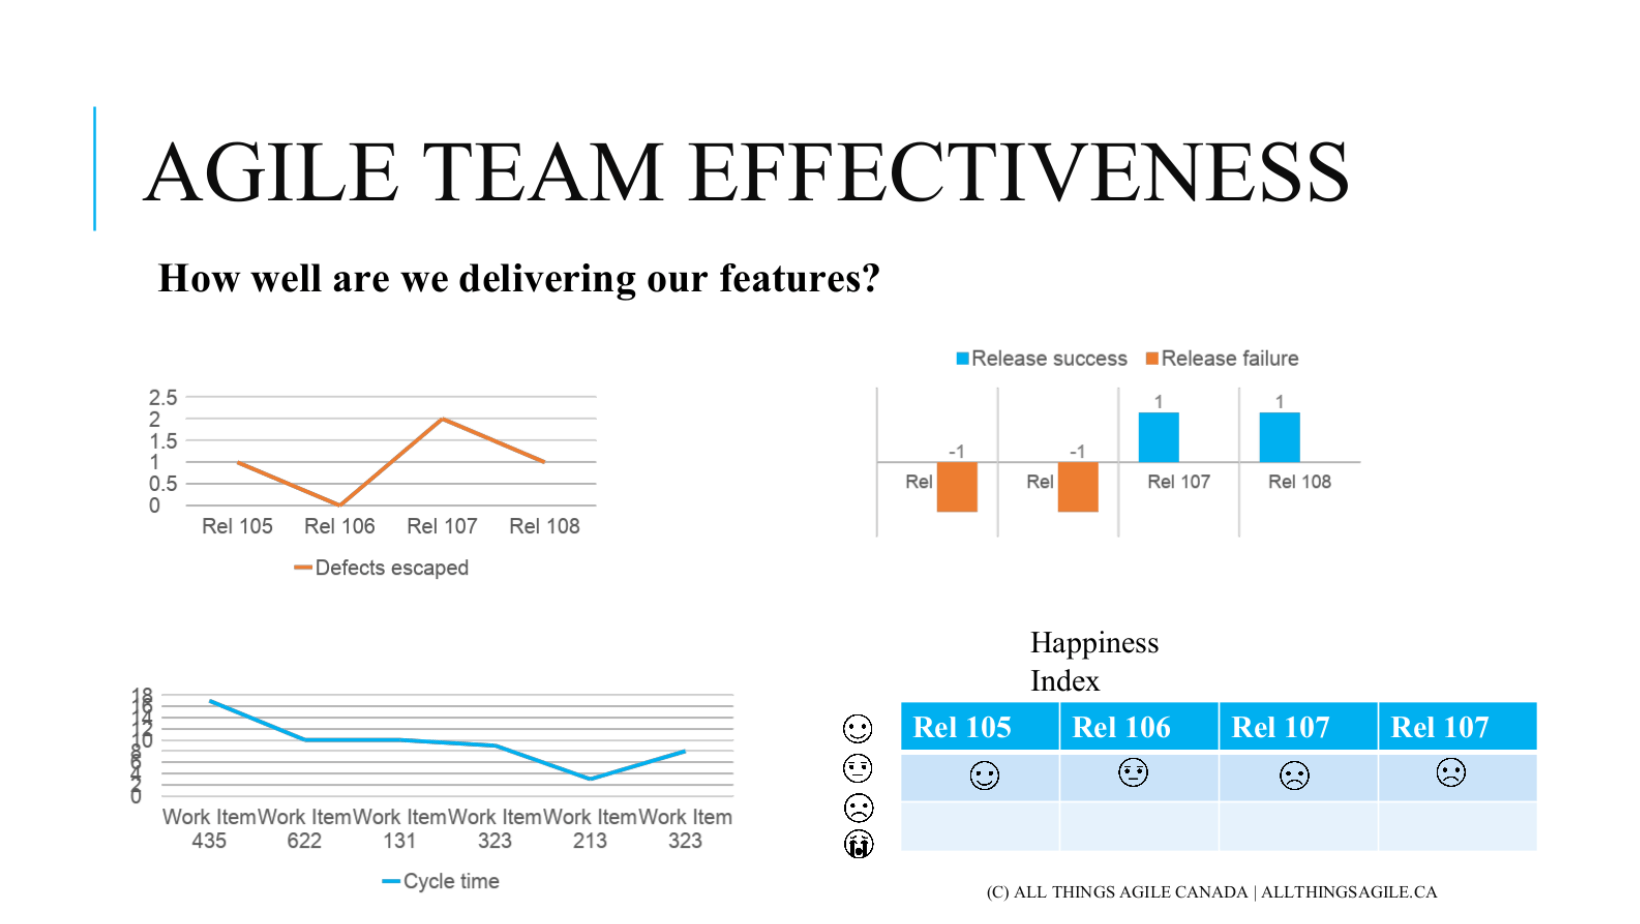
For the trend on effectiveness of delivery, we might measure stories planned x delivered (burndown on count), avg cycle time of stories & trend, or rato of stories delivered x escaped defects (aiming for 0 defects).
For trend on release health, we might measure the number of releases per month (threshold of 4) or the number of failed releases.
For trend on team morale, we might create a survey where team members are asked to rate how much they agree with statements like “I find fulfillment at work”, “I feel accountable”, “I like our processes”, “the pace is right” on a scale of 1 – 10.
When we look at the data, we can see we are getting faster, there are more defects, the releases got better, and we are unhappy. If you look at only one measure, it looks simple. But you need the whole picture. This is the best way to use your measures. Go a few retrospectives with the same question and really look at it from several different angles, time and time again.
You’ll notice that there will be some measure that calls out to you more and those are the ones you want to really address first. Over time, you may want to switch out measurements as needed to zero in on problems. Because remember, you want to take action.
You want to take a customer laser focus
- Your question: “how good are we at responding to our customer’s needs?”
- We look at NPS, retention rates, and lead time, OR % of SLA’s respected and number of incidents
You want to take a holistic focus
- Your question: “how healthy is our ecosystem of development?”
- We look at NPS score + lead time + # of escaped defects + # of releases per day + happiness index
Don’t Forget
The difference between great teams and those that are suffering is that some are just asking better questions instead of just focusing on the measure of the moment.
Insights for measures to be helpful:
- Trends are better than absolutes (in general)
- Ratios are better than absolutes
- Percentiles are better than absolutes
- Use data, not estimates
- Use them for forwards action as most are lagging
- Some good measures leading but it’s hard to find correlation


